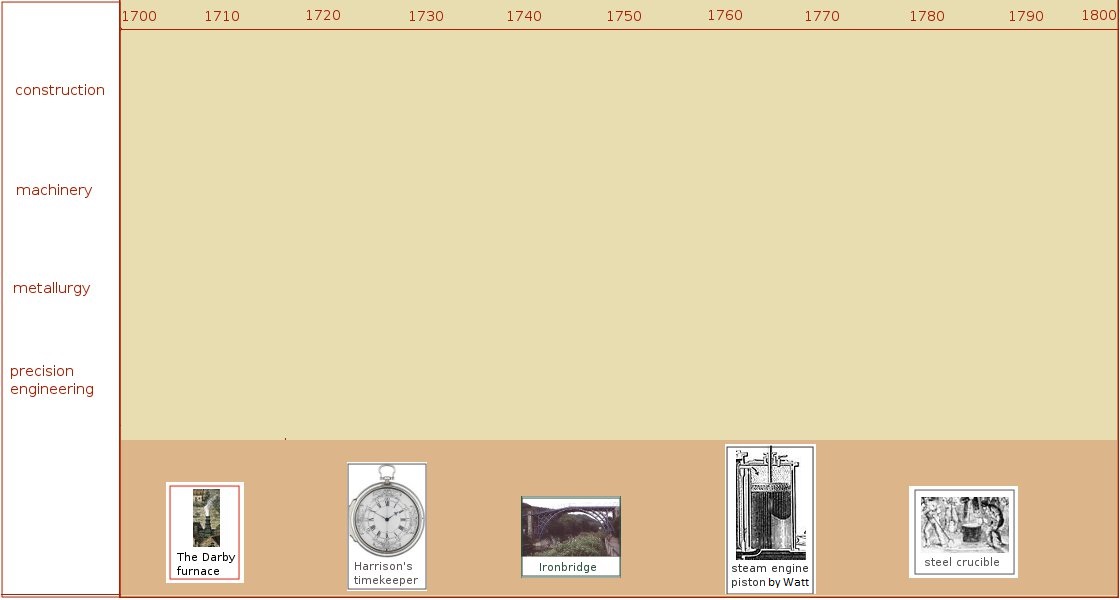
The flowchart of industry
Conditions d’achèvement
![]() If you need definitions of the different types of exercises or activities to be submitted on moodle, look at the User's Guide.
If you need definitions of the different types of exercises or activities to be submitted on moodle, look at the User's Guide.
The text below is a 'read-only' question; it is meant to give visitors an idea of possible exercises. Registered students should click on the 'Submission' button available to them in order to move to the exercise page and write or attach their contribution.
The exercise is based on chapters of the Georgian Cities website on Urban Growth - more particularly the pages on Ironbridge, Sheffield, Birmingham.
The purpose of the exercise is to complete the following flowchart so as to place the inventions mentioned on the timeline; you will need the same simple paint program as for the exercises in Unit 1:
- save the image below, in the usual way to save images from the web (right-click on it and select 'save image' in the pop-up menu, as explained in the exercise on Dockyards at the beginning of the present Unit); cut the icons below representing five inventions (here placed in alphabetical order) by selecting them with the rectangular selection tool and choosing 'cut' then 'paste' them on the chart, positioning them at the appropriate intersection of the timeline (column giving the dates of the decades) and category (row for the categories of industries concerned)
- add arrows (with the drawing tool, drawing straight lines) showing the cause-and-effect sequence between the events represented by the icons, where applicable: the result will be a flowchart
- write a paragraph to explain your decisions.
Skills:
- basic image editing
- flowchart design
- revision on major landmarks in industrial history